


I Tried Hundreds Of Stock Investing Tools — This Is The One That Generates Profit Consistently
I’ve used them over the past 10 years. Save yourself years of trial and error.


Investing in the stock market already has its challenges, especially for new investors. There is so much information and material to navigate, whether choosing between fundamental or technical analysis or investing in stocks or commodities.
One clear thing is that traders and investors all want the same outcome. To buy a stock that is going up and make a profit. This outcome is achievable once you learn to simplify the process of investing.
The charting software I use includes over 100,000 indicators. There’s no way you will need that many, but investors often fall into the trap of shiny object syndrome, believing each new indicator will bring them massive profits.
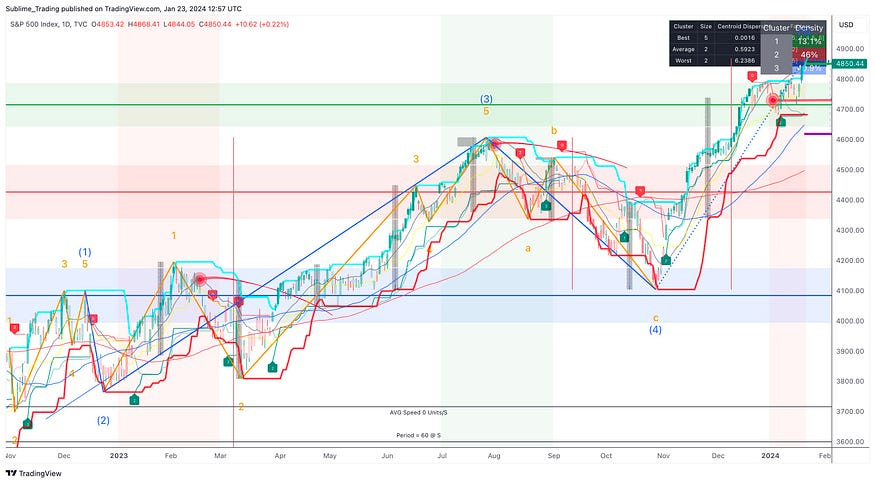
From my experience of investing in the stock market for over ten years, too many indicators will confuse you and lead to consistent losses. Look at the chart below of the S&P 500 and see if you can make a profitable investment decision based on the information provided.
How did that go?
Let me guess: It’s not easy to dissect the chart and pick the relevant data. You’re not alone — that’s how most new investors feel.
The chart below is the same chart of the S&P 500 above. Look how clean it looks now with no fancy indicators. Now, you can clearly see the chart is moving up, suggesting that it’s a good time to consider buying stocks.
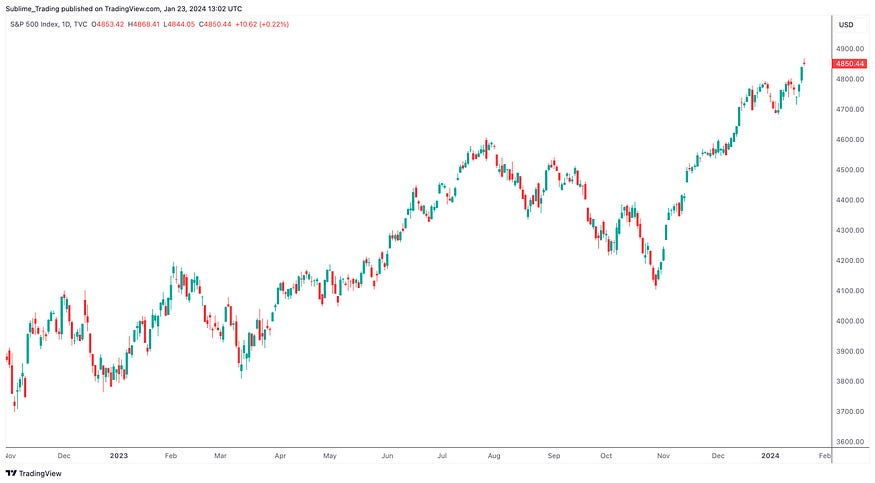
Less is more.
From the 100,000 indicators in my charting software, there is one powerful and often overlooked indicator, based on its simplicity, that can cut through the market noise and help investors identify profitable trends.
This tool is the moving average (MA) and I will show you how to use it effectively.
It has three main uses:
It is highly reliable for telling us if the overall market is moving up or down.
It tells us how strong the uptrend or downtrend is.
It identifies significant levels of support and resistance.
How You Should Use The Moving Average (MA)
The MA, or the simple moving average (SMA), is an indicator used by investors who employ technical analysis strategies. It is a line plotted on a chart that averages out the price of an asset over X number of days.
This indicator would take hours to draw on graph paper by hand before computers were widely available for traders. Modern computers can plot the SMA instantly.
Different settings can be used to plot the SMA, but three key SMAs can drastically improve the selection of stocks added to your portfolio.
They are the 20, 50, and 200 SMAs, and they are powerful, user-friendly tools. They are also available on most free charting software, making them widely accessible.
Using the moving averages in how I am about to share will help filter out poor-performing stocks. Other tools play a part in my stock selection, but these moving average settings alone boost my performance and keep investing consistently profitable.
The Strongest Moving Average You Can Use
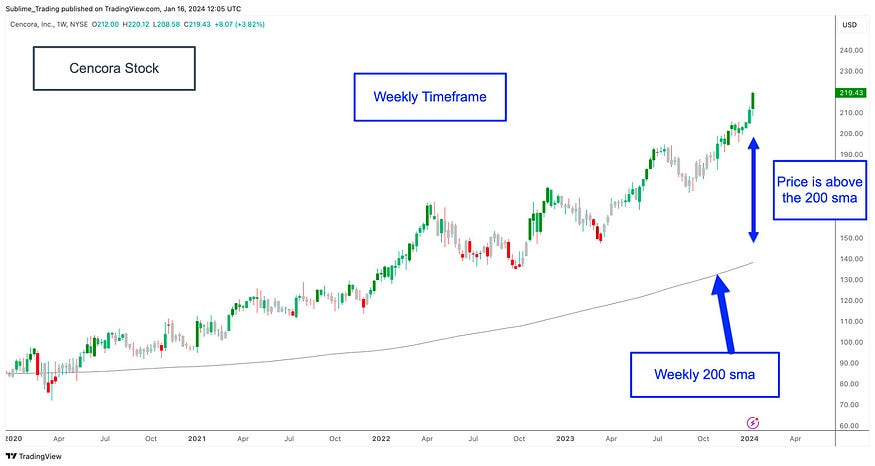
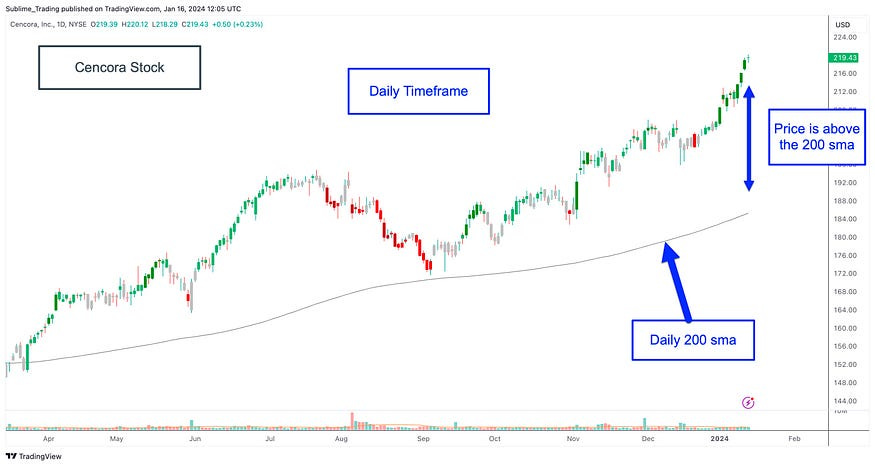
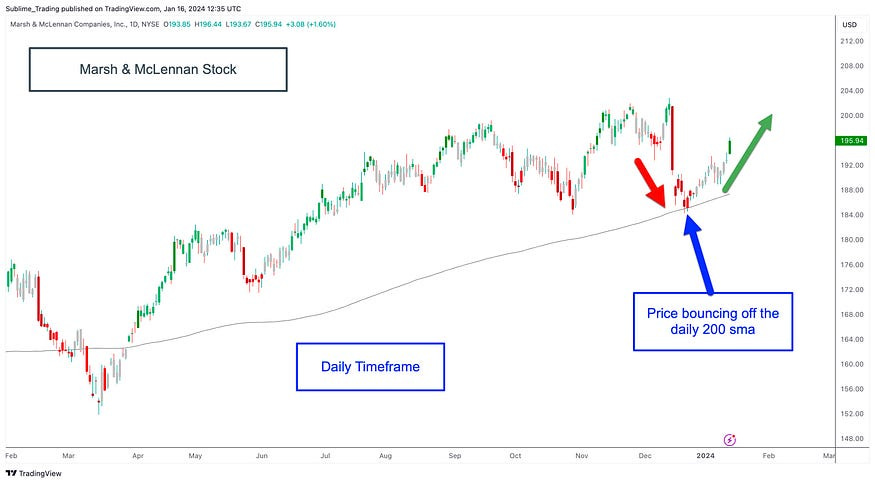
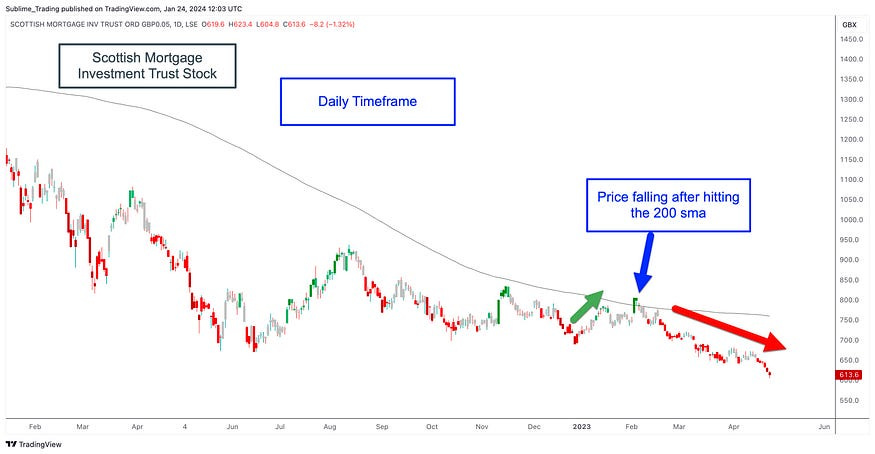
The 200 SMA is the most important of the three. It averages out the stock price over the past 200 trading days. If the stock price is above the 200 SMA, the bias is bullish, and the stock will likely move higher. The indicator is best used on the weekly and daily timeframes.
If the stock price is below the 200 SMA then the bias is bearish, and the stock is likely to move lower.
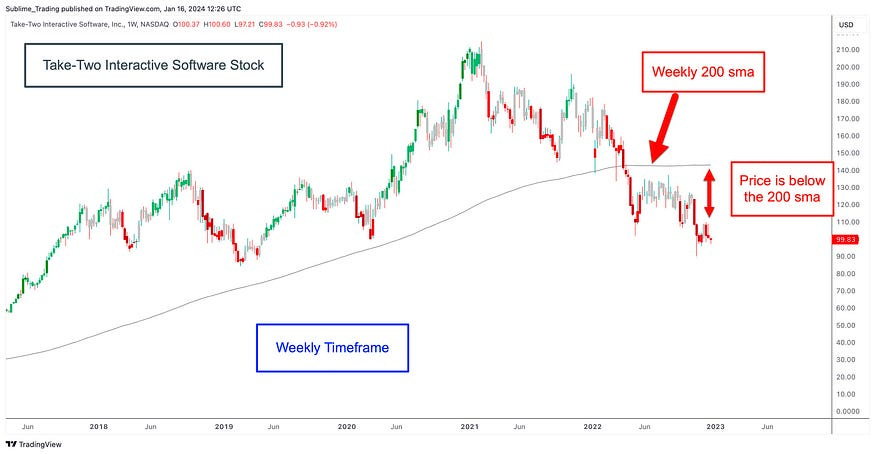
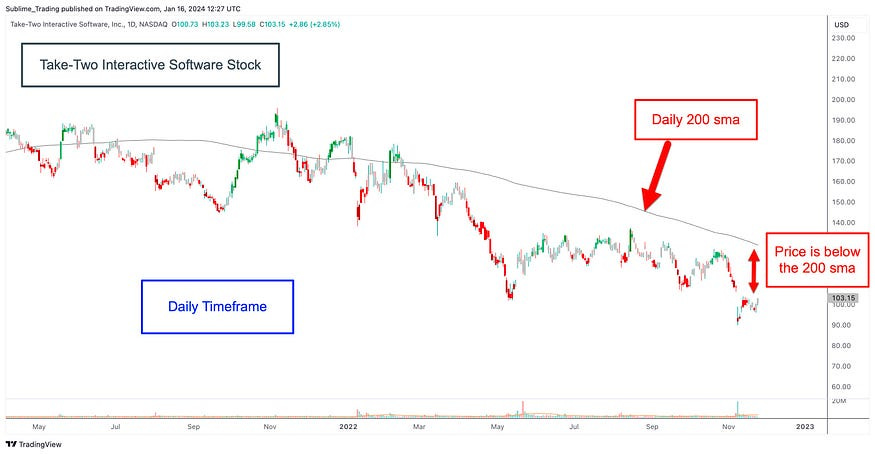
The 200 SMA also has another role. It identifies significant levels of support and resistance, highlighting major turning points in the market.
If a stock is above the 200 SMA and falls back down, it can often use the 200 SMA as a support level and bounce back to the upside.
If a stock is below the 200 SMA and moves back up, it can often use the 200 SMA as a resistance level and fall back down.
Using The 20 & 50 Settings
The 20 and 50 SMAs are used to identify the quality of a trend. Let’s say a stock is trading above the 200 SMA and trending up. The 20 or 50 SMAs will determine how strong the trend is.
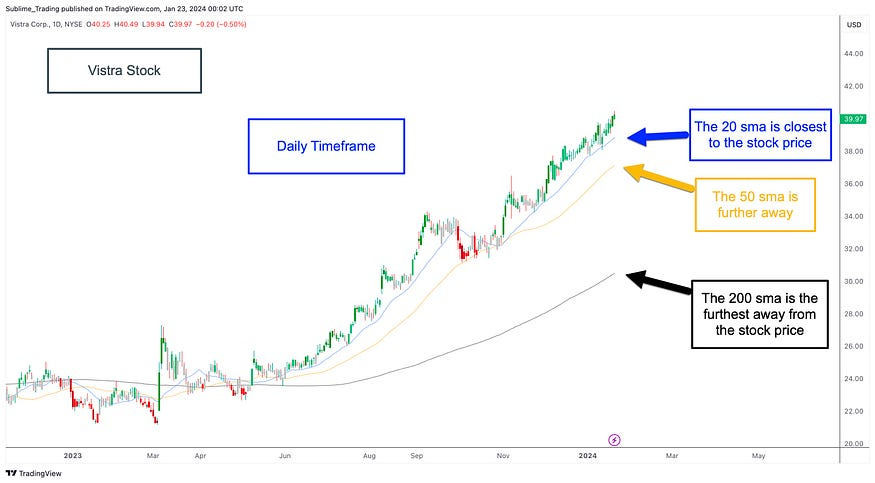
The 20 SMA being closer to the price on a chart helps us identify a strong linear trend when used as support during an uptrend.
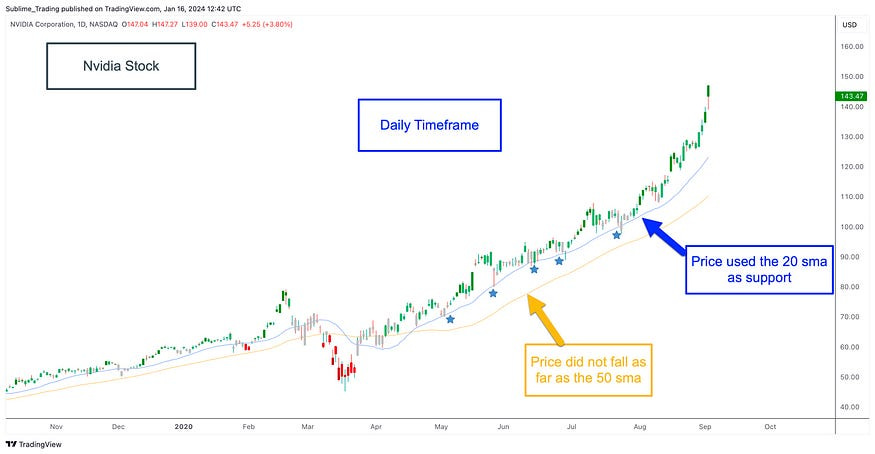
If the pullbacks fall further and reach the 50 SMA, it suggests a slightly weaker trend but still holds the potential to be a strong and consistent performer.
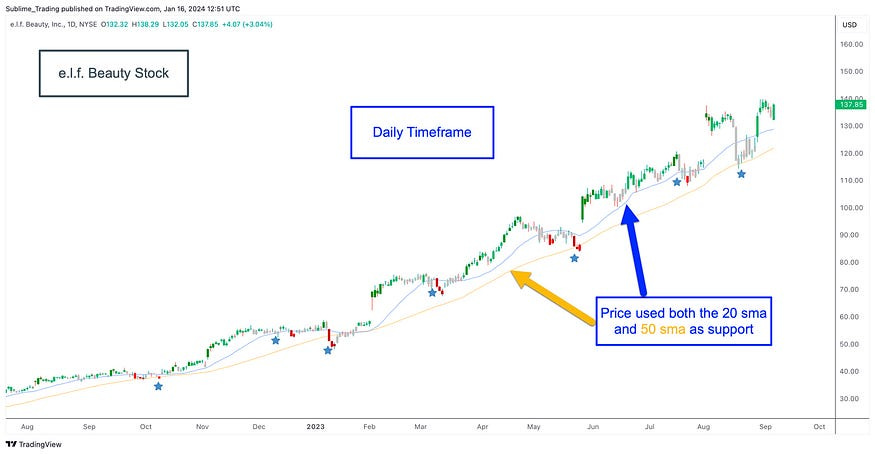
Ideally, I look for stocks trending above the 20 SMA as they deliver profit much faster. Trends using the 50 SMA can still produce good profits along the way up. They may take slightly longer, but they are still profitable.
I use the 50 SMA on the weekly and daily timeframes, and the 20 SMA on just the daily timeframe.
How To Profitably Use The Moving Averages
This tool has helped me make smart investment decisions every year, and I’ll share a few of the stocks I invested in.
The first stock is Microsoft (stock ticker MSFT).
I begin by checking the stock’s position in relation to the moving averages on the weekly timeframe.
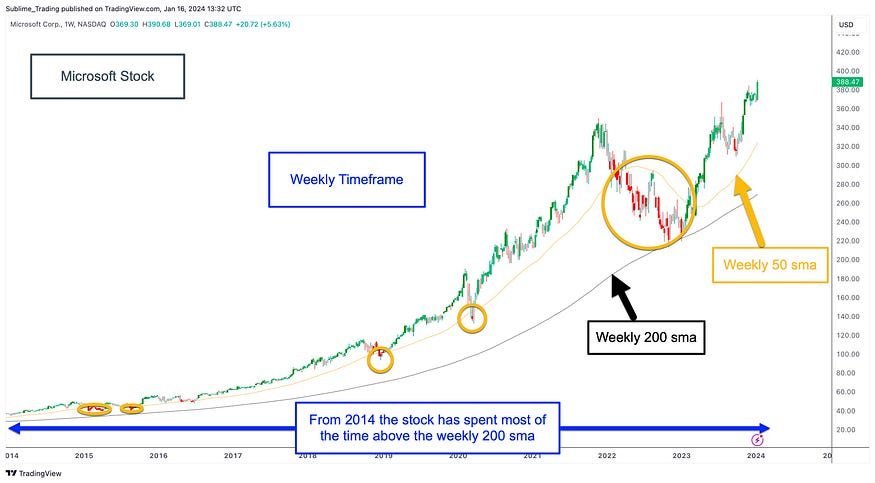
Microsoft remained above the weekly 200 SMA from 2014.
It remained above the weekly SMA most of the time, but there were periods (circled areas) when the stock moved below it, which is normal. This clearly shows that this stock has a solid history of upward trends.
The past performance of a stock is a strong indication of future performance.
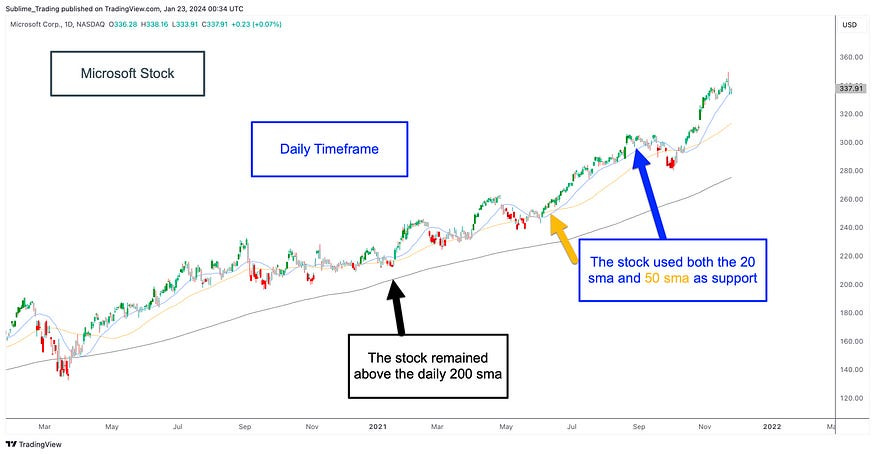
During the trend on the daily timeframe, the stock used both the 20 and 50 SMAs as support. This led to a consistent uptrend, although it would have been stronger if it had stayed above the 20 SMA.
The stock remained above the 200 SMA for the duration of the trend.
When a stock drops to the 50 SMA, it can enter a sideways movement phase for lengthy periods. This can frustrate investors, leading them to sell their investments as a sideways stock does not generate profit.
Understanding the role of each moving average is crucial for determining stock behavior and making informed decisions with confidence. Staying with Microsoft proved profitable due to the bullish trend the SMA helped me identify.
The following stock is Cboe Global Markets (stock ticker CBOE).
Again, we’ll start with the weekly timeframe.
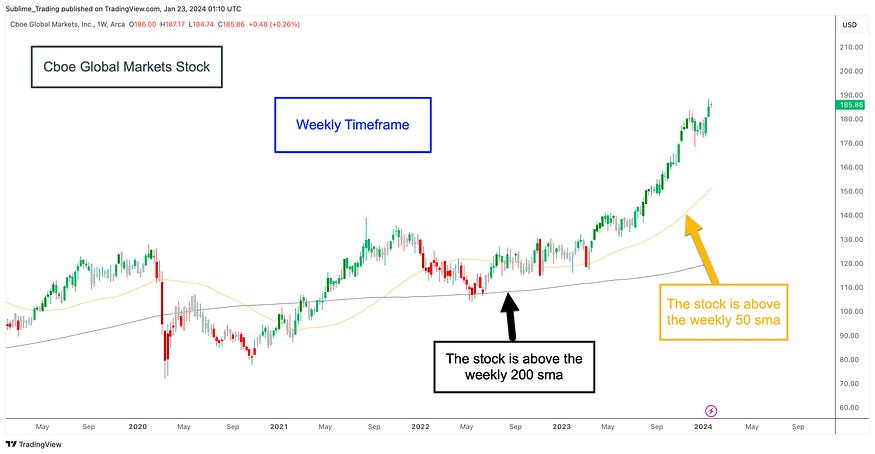
The stock is above the weekly 50 and 200 SMAs, and a bullish trend is visible. There were periods when the stock traded below the moving averages, but that was during its consolidating phase. Once it gained buying momentum, it took off.
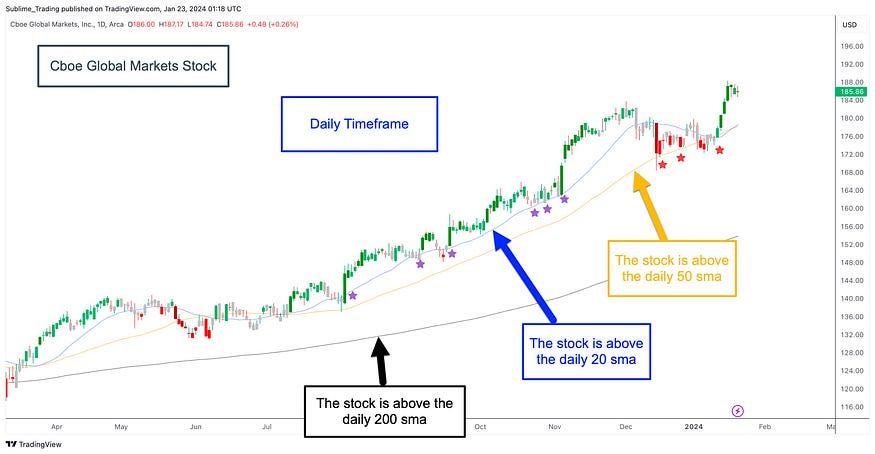
Unlike the daily chart for Microsoft, where the trend remained consistent, this stock’s behaviour fluctuated. It trended above the 20, 50 and 200 SMAs, but there were periods (purple stars) where the stock remained above the 20 SMA only. The stock moved up fast during this period, forming a linear trend.
But later in the trend, the behavior changed, and there was a deeper decline towards the daily 50 SMA (red stars). This often happens because buying momentum eventually slows down.
Without knowing this, the decline towards the 50 SMA may have been misinterpreted as a trend reversal, causing investors to sell. I always anticipate declines to either the 20 or 50 SMAs. As long as either one acts as support, I will leave my investment to continue running. If the stock price falls further than the daily 50 SMA, I implement my exit strategy to avoid returning the accumulated profit to the market.
The Moving Averages Will Save You From Large Losses
You want to exit when the stock price crosses below the 20 and 50 SMA because it could either fall into a deep decline or consolidate and move sideways. Both scenarios can last for months or even years, and you don’t want to wait that long when your capital can be put to good use in other stocks.
Here is an example of the stock Paypal (stock ticker PYPL).
I was invested in this stock and was able to profit from the uptrend. The stock eventually ran out of momentum and then declined after struggling to climb above the $300 psychological resistance level.
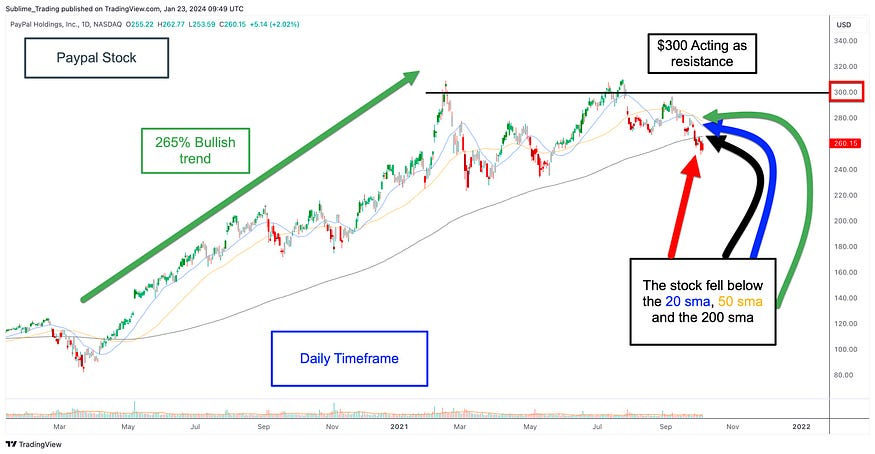
This move clearly indicated that PayPal was unlikely to continue moving up after the 265% bullish trend.
A large trend is usually followed by a deep correction.
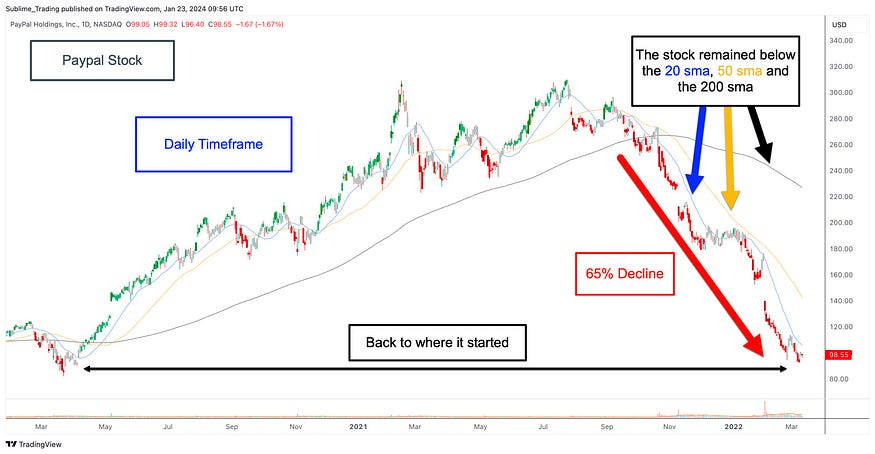
My early decision to take action paid off. The 265% uptrend was followed by a decline of 65% and returned to the level where the uptrend began.
The moving averages can also be used to profit from a declining stock, as long as it remains below the 20, 50 and 200 SMAs as it did with the Paypal chart above. This is called going short, and I will cover it in a future article.
Overcome Your Shiny Object Syndrome
I’m sure you will have a ton of indicators on your charts because they all promise to make you money. What I’ve learned is that the price action of a stock is more important. You need to know if the stock is moving up, down, or sideways. Once You know this, you can take the appropriate action. The moving averages I just shared gives you that information.
If this feels so simple that you believe it can’t be effective, but you are not getting the desired results, then apply it to a few charts and see for yourself. It will block out any confusion you have about which direction you think the market is moving and streamline your analysis process.
Let moving averages lead you on your way to smarter and more profitable investing.